Odd returns are surfacing, and the coronavirus is the culprit
I’ll confess to a bit of hyperbole or misdirected blame here. We can’t really credit the coronavirus, but the markets have been extremely volatile, and whenever that happens, we are bound to see some odd returns.
Last month, I was presented with a problem from a client, and did a bit of analysis to try to uncover the cause. The result led to an introductory video on this, as well as an article, to appear later in The Journal of Performance Measurement(r).
A colleague suggested that this problem may become more evident, as firms begin to prepare their first quarter results, and this suggestion turned out to be at least somewhat prescient, as another client just passed me a problem to review. My initial thinking is that it is related to what I previously discovered. And so, I will share with you a bit about it.
Here’s the problem:
 And what do we see?Well,
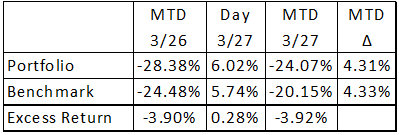
- the portfolio’s month-to-date (MTD) return through 3/26 was -28.38%, while its benchmark was -24.48%, meaning the excess return was -3.90%
- the following day (3/27), the portfolio outperformed the benchmark by a sizable amount: 6.02% vs. 5.74%, for an excess return of 0.28%
- but when this day (3/27) was linked to the 3/26 MTD returns, we see that the situation got worse, not better, for the portfolio: the MTD excess return had grown to 3.92%
- where did that extra -0.2% (two basis points) come from?
Imagine you’re the portfolio manager who monitors his/her performance daily. They feel great about the return they had on 3/27, and so fully expect to see an improvement in their excess return relative to the benchmark, but the portfolio analyst hands them a report showing a further degradation in performance. What’s going on?
Yes, what’s going on?
When you encounter odd returns similar to what we have here, you may need to do some analysis to figure out what’s occurring.
If you’re thinking this problem has something to do with compounding, you are correct.
I had known that in “positive space,” the impact of a return on an existing cumulative return would vary, depending on the size of the cumulative return. If, for example, we link a 1% return to a cumulative return of 2%, vs. 20%, for example, we will get different incremental results; the impact of the return will vary, depending on the size of the return it’s being geometrically linked to.
There are times when these differences can be quite significant, causing one to wonder if they’re correct, as it may seem that the manager is getting more of a reward then they deserve.
Well, in negative space, the same situation holds. However, contrary to what you might think, a “large negative” (e.g., -50%) will see less of an impact than a “small negative” (e.g., -3%).
In this particular scenario, while the portfolio had a much better day than its benchmark (6.02% vs. 5.74%), because the benchmark’s MTD return leading up to that day was so much bigger (-24.48% vs. -28.38%), the benchmark’s 5.74% return had a greater impact on its cumulative result than the 6.02% had on the portfolio’s.
I applied the portfolio’s 6.02% return to a series of cumulative returns, ranging from -93.90 to +96.00 percent, to see what the incremental impact would be. The following table shows the results.
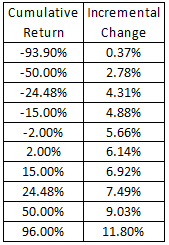
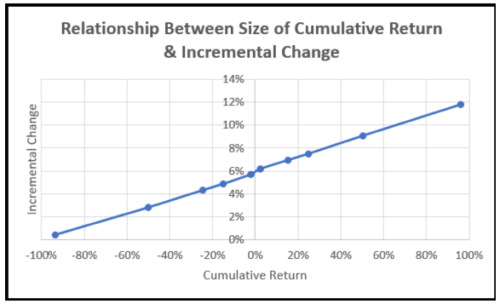
We can see that while this 6.02% only made a 4.31% difference at the portfolio’s -24.48% level, the manager who is fortunate enough to have a positive return will garner consistently higher incremental benefits.
It turns out that this relationship is linear!
Explaining odd returns
And so, if you encounter a situation like this, how do you respond?
Well, I’d begin with a bit of analysis, to confirm that the impact is something like what I describe here. If it is, then I’d explain that while you might have a great day, the impact that day will have on the cumulative result will depend on their respective signs and sizes. Larger positive returns see a greater impact than smaller, especially smaller negative, returns.
Once we turn this market around, we’ll hopefully see greater rewards as we move back into positive space.
More to come …
As noted above, we will have an article on this topic in an upcoming issue of the Journal. If you’d like an advance copy of the article, send me an email: DSpaulding@tsgperformance.com. Note that depending on where we are in the review stage (all articles go through a double-blind review, though my reviewers usually know the article’s from me, though I don’t know who they are).
And if you encounter an unusual scenario you’d like to share, please send it to me. Thanks!